74 Imaging of the Central Nervous System
 Key Points
• The emergency physician needs to be able to accurately interpret and act on certain findings on computed tomography (CT) because many disease processes require immediate action.
• Even with a brief educational intervention, emergency physicians can significantly improve their ability to interpret cranial CT scans.
• Use the mnemonic “blood can be very bad” (where blood = blood, can = cisterns, be = brain, very = ventricles, and bad = bone) to quickly and thoroughly review a cranial CT scan for pathology.
• Magnetic resonance imaging offers excellent anatomic resolution and provides greater discrimination of various soft tissues than CT does.
Perspective
Imaging of the central nervous system (CNS) has assumed a critical role in the practice of emergency medicine for the evaluation of intracranial emergencies, both traumatic and atraumatic. A number of studies have revealed a deficiency in the ability of emergency physicians (EPs) to interpret head computed tomography (CT) scans.1–6 However, a number of these same studies also show that with even brief educational effort, EPs can gain considerable proficiency in cranial CT scan interpretation.2,3 This is important because in many situations the EP must interpret and act on head CT results in real time without assistance from other specialists such as neurologists, radiologists, or neuroradiologists.7,8 Advantages of using these technologies for diagnosing CNS pathology in the emergency department (ED) include widespread availability at many institutions, speed of imaging, patient accessibility, and sensitivity in detecting many emergency pathologic processes.
Computed Tomography
Attenuation Coefficient
The tissue contained within each image unit (called a pixel) absorbs a certain proportion of the x-rays that pass through it (e.g., bone absorbs a lot, air almost none). The ability to block x-rays as they pass through a substance is known as attenuation. For a given body tissue, the amount of attenuation is relatively constant and is known as that tissue’s attenuation coefficient. In CT, these attenuation coefficients are mapped to an arbitrary scale of between −1000 Hounsfield units (HU) (air) and +1000 HU (bone) (Box 74.1). This scale is the Hounsfield scale (in honor of Sir Jeffrey Hounsfield, who received a Nobel Prize for his pioneering work with this technology).
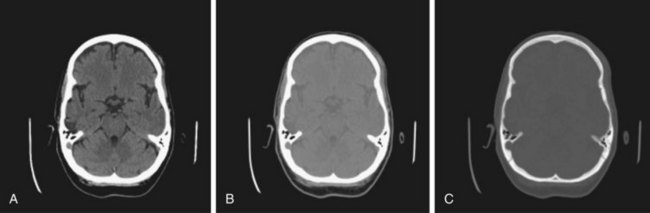
Windowing
Windowing allows the CT scan reader to focus on certain tissues within a CT scan that fall within set parameters. Tissues of interest can be assigned the full range of blacks and whites rather than a narrow portion of the gray scale. With this technique, subtle differences in tissue densities can be maximized. The image displayed depends on both centering of the viewing window and the width of the window. Most CT imaging includes windows that are optimized for brain, blood, and bone (Fig. 74.1).
Normal Neuroanatomy As Seen On Head Computed Tomography
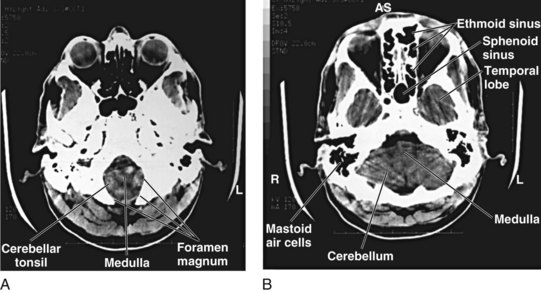
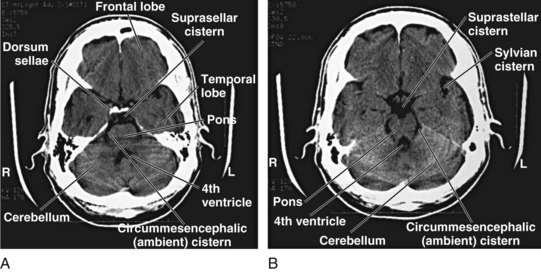
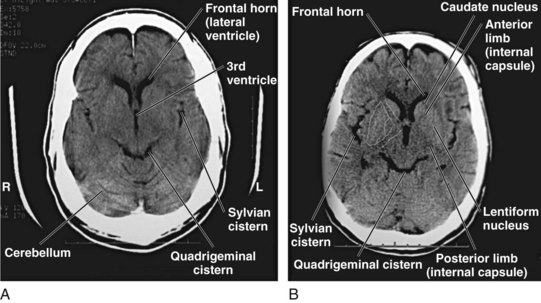
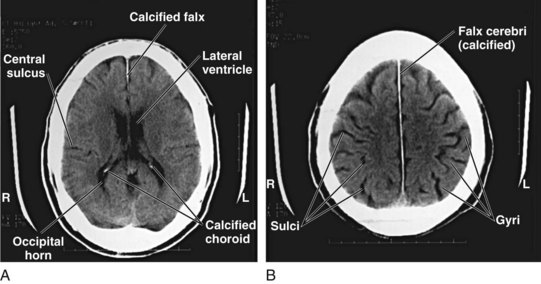
Although detailed knowledge of cranial neuroanatomy and its CT appearance is clearly in the realm of the neuroradiologist, familiarity with a relatively few structures, regions, and expected findings allows sufficient interpretation of most head CT scans by the EP. Figures 74.2 through 74.5 demonstrate key structures of a normal head CT scan.
Identifying Central Nervous System Pathology On Cranial Computed Tomography
As long as one is systematic in the search for pathology, any number of techniques can be used when reviewing head CT images. Some recommend a “center-out” technique in which the examiner starts from the middle of the brain and works outward. Others advocate a “problem-oriented” approach in which the clinical history directs the examiner to a particular portion of the scan. In the author’s experience, both these approaches are of limited utility to clinicians who do not frequently review scans. A preferred method, one that has been demonstrated to work in the ED, is to use the mnemonic “blood can be very bad” (Box 74.2).2 In this mnemonic, the first letter of each word prompts the clinician to search a certain portion of the CT scan for pathology.
Box 74.2 The “Blood Can Be Very Bad” Mnemonic*
Blood—Acute hemorrhage appears hyperdense (bright white) on computed tomography. The globin molecule is relatively dense and effectively absorbs x-ray beams. As the blood ages, the globin molecule breaks down and loses its hyperdense appearance, beginning at the periphery. Precise localization of the blood is as important as identification of its presence.
Cisterns—Cerebrospinal fluid collections in the brain. The four key cisterns must be examined for blood, asymmetry, and effacement (representing increased intracranial pressure):
Ventricles—Pathologic processes cause dilation (hydrocephalus) or compression or shifting; hydrocephalus is usually first evident with dilation of the temporal horns (normally small and slitlike); the examiner must assess the “whole picture” to determine whether the ventricles are enlarged because of lack of brain tissue or increased cerebrospinal fluid pressure.
Related posts:


Full access? Get Clinical Tree


