Chapter 6 Hemodynamic Monitoring
1 What is the purpose of hemodynamic monitoring?
Oxygen and fuels are brought to the tissues and waste products are removed by the flow of blood. The goal of hemodynamic monitoring is to assess whether the circulatory system has adequate performance in this regard to sustain organ function and life. Notably, hemodynamic monitoring provides data to guide therapy but is not by itself therapeutic.
2 How do manual blood pressure cuffs differ from automatic blood pressure cuffs?
Manual auscultation of the blood pressure assigns systolic value to the pressure measured when the first Korotkoff sound is heard and diastolic value to the pressure measured when the fourth Korotkoff sound disappears. Automatic blood pressure cuffs measure oscillations in pressure, caused by blood flow across a range of blood pressures; they determine only the mean blood pressure, which is determined by the point of greatest oscillation. With use of proprietary algorithms, the systolic and diastolic blood pressures are calculated. Both methods are susceptible to error with poor cuff size (which should cover two thirds of the limb segment), motion artifact, arrhythmia, and extremes of blood pressure.
3 How are arterial lines calibrated, and what factors affect readings?
Arterial lines generate blood pressure readings using pressure transducers. To yield useful information, the transducers must first be zeroed and leveled (positioned appropriately). Second, the system should be monitored for damping and resonance.
Zeroing and leveling eliminate the effects of atmospheric pressure and hydrostatic pressure, respectively, on blood pressure readings. Atmospheric pressures are set to zero so that reported values are relative pressures. If the system is not zeroed appropriately, measurements will continuously offset by a fixed amount. Errors can also occur if the transducer is physically lowered so that it will read a higher pressure and vice versa (potential energy is replaced by pressure to maintain energy in the fluid; read about Bernoulli’s equation for more). Therefore it is crucial to position the transducer at the height of interest (e.g., external acoustic meatus to approximate pressure at the circle of Willis).
Damping is the tendency of an oscillating system to decrease oscillation amplitude. In the case of an arterial line, the systolic and diastolic readings tend to converge around the mean pressure. Damping results from medium or large air bubbles in the circuit, compliant tubing between the transducer and cannulation site, loose connections, or kinks. Resonance or whip causes falsely increased systolic readings and falsely decreased diastolic readings. It occurs when the system’s frequency of oscillation (i.e., heart rate) matches the system’s natural frequency of vibration causing whip in the signal. The classic example of this (though not easy to accomplish) is breaking a wine glass by singing a note of the same frequency as the wine glass’s resonant frequency.
4 In what situations should arterial line placement be considered?
Inability to obtain noninvasive blood pressures.
Hemodynamic instability. Patients who need monitoring because of extremely high blood pressure, extremely low blood pressure, or extremely volatile blood pressure.
Need for rigorous blood pressure control. Patients who need blood pressure kept within a tight range (e.g., status post aortic aneurysm repair).
Need for frequent arterial blood sampling. Patients with severe ventilation compromise, oxygenation compromise, or other condition where it is useful to follow serial laboratory values with an arterial line.
Choice of cannulation site is important because each site has unique benefits and risks. The radial artery is often chosen given the convenient location and good collateral supply to the hand. In patients with severe vasoconstriction, however, a femoral line may be preferable because the radial pressure may underestimate central arterial pressure.
5 How do arterial tracings differ between proximal and distal cannulation sites?
Arterial tracings become more peaked with higher systolic pressures but similar mean pressures as one transduces sites progressively distal from the aorta. The dicrotic notch representing aortic valve closure is seen in the aorta and its largest branches but becomes lost in peripheral arteries. A smaller second wave of pressure during diastole represents pressure waves reflecting off the peripheral resistance arterioles. This phenomenon can sometimes cause a pulse-oximeter to double count the pulse.
6 List indications for central line placement
Central lines are indicated for monitoring the central venous pressure, infusing concentrated vasopressors, delivering total parenteral nutrition, sampling central venous blood for analysis, and obtaining venous access when peripheral access cannot be obtained.
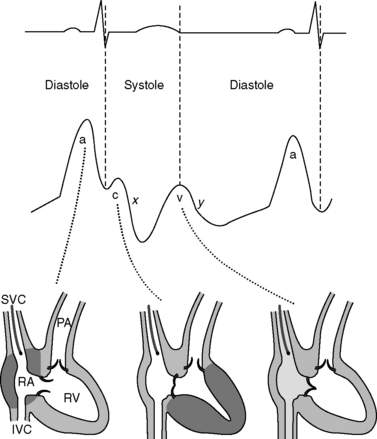
7 Describe the central venous waveform components. Which part of the waveform cycle should be reported as the central venous pressure?
Central venous pressures have predictable waveforms. These waveforms have upward deflections representing atrial contraction (“a” wave), ventricular contraction that causes the tricuspid valve to bulge into the atrium (“c” wave), and passive venous return of blood during diastole (“v” wave). (Note the somewhat counterintuitive fact that ventricular contraction coincides with the “c” wave, not the “v” wave.) The downslope after the “c” wave is called the “x” descent, and the downslope after the “v” wave is called the “y” descent. See Figure 6-1.
Figure 6-1 Central venous waveform components. IVC, Inferior vena cava; PA, pulmonary artery; RA, right atrium; RV, right ventricle; SVC, superior vena cava.
Central venous pressure should reflect the end-diastolic distention of the ventricle. Therefore the pressure measured should be immediately before systole. This corresponds to the valley immediately before the “c” wave and immediately after the “a” wave. In addition, because intrathoracic pressure (which is transmitted to the central veins) varies with respiration, pressures should be measured at end-expiration to minimize this effect on measurements.
8 List the indications for pulmonary artery catheter (PAC) placement
Indications to place a PAC include monitoring pulmonary artery pressures, measuring cardiac output by using thermodilution, assessing left ventricular filling pressures, and allowing sampling of true mixed-venous blood.
9 Describe complications of central line or PAC placement
Central line complications include pneumothorax, arterial puncture, line infection, arrhythmia, hematoma, and deep venous thrombosis. Rarer complications include thoracic duct injury and cardiac tamponade.
All the aforementioned central line complications can also arise during PAC placement. In addition, PAC placement can result in transient right bundle branch block through direct mechanical irritation of the right ventricle; therefore, PACs are relatively contraindicated in patients with left bundle branch blocks because of the potential for complete heart block. Lastly, pulmonary arterial rupture, which is usually fatal, can occur if care with the balloon tip is not taken.
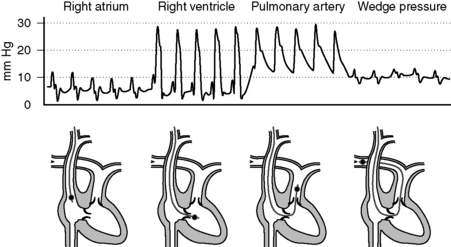
10 Describe normal pressures and waveforms encountered as a PAC is advanced
The inflated balloon on the distal tip will advance with the flow of blood through the superior vena cava, right atrium, right ventricle, and ultimately the pulmonary artery. Different waveforms are obtained at each position as illustrated below.
The right atrial pressures are similar to central venous pressures described in question 7. Right ventricular pressures will have systolic components that are in phase with (i.e., occur synchronously with) systemic arterial systolic pressures and have low diastolic pressures that increase during diastole. Systolic pulmonary arterial pressures will also be in phase with systemic arterial systolic pressures and have similar waveforms that gradually decrease during diastole. The pulmonary artery occlusion pressure (PAOP)—or wedge pressure if no balloon is used—reflects the left atrial pressure and thereby left ventricular filling. Because the wedge pressure reflects the left atrial pressures, it may have “a,” “c,” and “v” waves, although in practice these may difficult to identify. Large “v” waves due to mitral regurgitation can occur on the PAOP trace, but these large “v” waves will occur during late systole and early diastole. See Figure 6-2.
Full access? Get Clinical Tree
