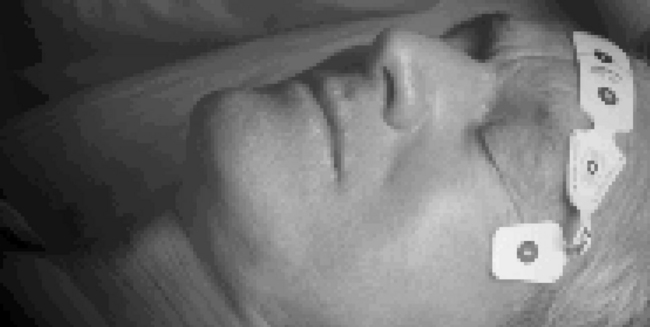
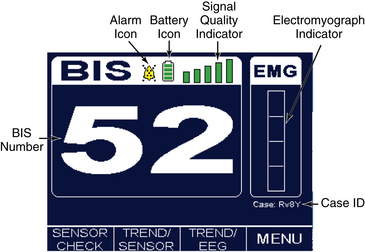
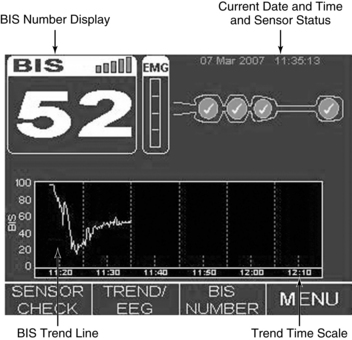
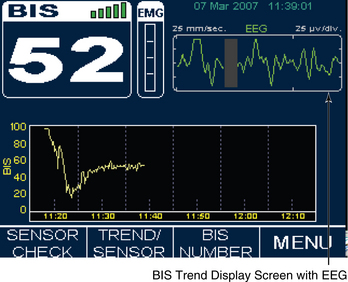
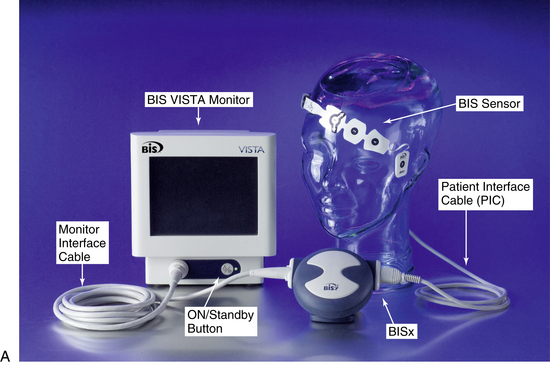
PROCEDURE 86 The bispectral index is a processed electroencephalogram-based parameter used in critically ill adults for assessment of level of consciousness and response to sedative, hypnotic, and anesthetic agents.1–4,10,13,16 The bispectral index also may indicate an arousal response to painful stimulation.2 Information derived from bispectral index monitoring may be used to guide sedative, hypnotic, and analgesic therapy.2,4,10,16 • Understanding of cerebral physiology is needed. • Sedative, hypnotic, anesthetic, and analgesic agents produce clinical effects as a result of binding, in a dose-related manner, with specific receptors in the brain modulating cerebral physiology.24,34 • Understanding of the interrelationship between the electrical activity of the brain and cerebral metabolism is necessary. • Electroencephalogram (EEG) tracings are obtained and recorded through the application of scalp electrodes and detect electrical activity in the brain.33 • Examination of EEG waveforms provides a complement to central nervous system (CNS) evaluation obtained through clinical neurologic assessment. • On its basic level, EEG activity requires multiple energy-using steps, which need to occur in succession. These steps include electrical impulse discharge at the thalamus and impulse conduction to the cerebral cortex with associated presynaptic release of neurotransmitters. • Any clinical state or therapy that affects cerebral metabolism may also affect the EEG.12,18,22,30 • See Table 86-1 for terminology associated with bispectral index (BIS) technology. Table 86-1 Bispectral Index Monitoring Terminology • The close relationship between BIS and EEG activity should be understood.25,33,35,36 • When BIS monitoring is initiated, a sensor is placed across the patient’s forehead per manufacturer recommendations to detect one channel of EEG activity (Fig. 86-1). • EEG activity is then subjected to multiple processing steps. • The BIS monitor may also provide bilateral EEG data acquisition from right and left frontal-temporal electrode placement (BIS VISTA bilateral monitoring system).7 • Understanding of factors that affect cerebral metabolism and EEG activity is needed. • Potential indications for BIS monitoring include: • Table 86-2 provides BIS values and correlation with clinical endpoints and level of sedation. Table 86-2 BIS Values, Corresponding Level of Sedation, and EEG State3,13,17,20 (Adapted from Arbour R: Continuous nervous system monitoring: EEG, the bispectral index and neuromuscular transmission, AACN Clin Iss 14(2):192, 2003.) • See Fig. 86-1 for placement of the BIS sensor. • Knowledge of factors that affect the BIS value is necessary. • Knowledge is needed of BIS display screen, monitor controls, and information array available on BIS monitor (Figs. 86-2, 86-3
Bispectral Index Monitoring
PREREQUISITE NURSING KNOWLEDGE
Bispectral Index (BIS)
Processed EEG that assesses level of consciousness and response to sedative, hypnotic, and analgesic therapy.
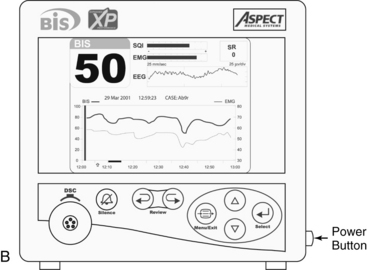
Digital Signal Converter (DSC)
Amplifies, filters, and digitizes the patient’s EEG signals.
Electroencephalogram (EEG)
Measures electrical activity of the brain.
Electromyelograph (EMG)
Measures the presence of muscle activity or detects high frequency artifact from patient care devices.
Signal Quality Index (SQI)
A measure of the signal quality for the EEG channel source and is calculated based on impedance to electronic signal, electrode contact artifact and other variables.
Suppression Ratio (SR)
Percentage of EEG suppression (isoelectric EEG) over the past 63 seconds of collected data.
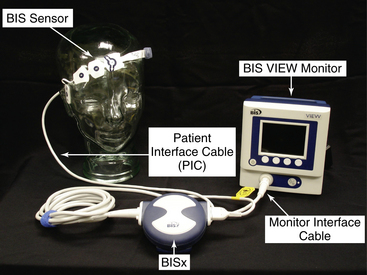
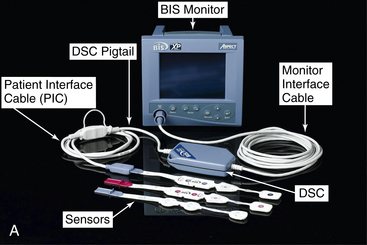
 The EEG signal is filtered and digitized within the amplifier head box (digital signal converter [DSC])2–4 (Fig. 86-4, A) or BISx5–7 near the patient’s head (Fig. 86-2, A and 86-3, A).
 Artifacts (low-frequency and high-frequency) are eliminated.
 The level of EEG suppression and near suppression is determined.
 The EEG features are combined to form the BIS, a single value that correlates with the level of consciousness and the specific EEG state.3,10,33,36
 The BIS value is a single number based on the previous 10 to 30 seconds of EEG data (depending on the smoothing rate setting on the monitoring system) and is updated frequently; thus, changes in BIS value may lag behind clinical changes.5,6
 The BIS monitor provides a single channel of an EEG tracing from the right or left frontal-temporal montage electrode placement (BIS A2000™, BIS VISTA™, BIS VIEW™; Fig. 86-4B).3–6
 Sedation (dose-related): Related to the modulation of the EEG state and level of consciousness from medication administration.1–3,34
 Analgesic agents (dose-related): Related to attenuation of the arousal response or sedation as a side effect of opioid analgesia in higher doses.1,2,16,34
 Anesthetic agents (dose-related).25,36,37
 Cerebral injury or hypoperfusion (hemodynamic stability, global neurologic injury, severe hypoxemia): Related to direct alterations in cerebral metabolic stability.9,18,26,29
 Use of neuromuscular blockade: BIS monitoring may help in identification of patients at risk for awareness, recall, and pain during paralysis.2,23,39,40
 Use of BIS values to guide sedation and analgesia.2
 Titration of sedation or analgesia in patients receiving controlled ventilation.5,7,15,23
 Avoidance of extremes of undersedation and oversedation.1,37
 Titration of medications for medication-induced coma.10,32,35
 Determination of the dosage of sedation or analgesia during end-of-life care.12,20
BIS Value
Corresponding Level of Sedation
Descriptors
100
Awake state; patient able to respond appropriately to verbal stimulation
Baseline state before sedation
Anxiolysis
80
Patient able to respond to loud verbal, limited tactile stimulation, such as mild prodding/shaking
High-frequency EEG activity
(Beta augmentation)
Moderate sedation
60
Low probability of explicit recall; patient unresponsive to verbal stimulation
Low-frequency EEG activity
Deep sedation
40
Patient unresponsive to verbal stimulation, less responsive to physical stimulation
Deep hypnotic state
Drug-induced coma; burst-suppression EEG pattern
20
Minimal responsiveness
0
No responsiveness mediated by brain function; spinal reflexes may be present
Isoelectric or completely suppressed EEG
 Sedation: Decrease in BIS value.11,14,15,21
 Analgesia: Decrease in BIS value from attenuation of cerebral arousal or sedation occurring as a side effect of high-dose opioid analgesia.1,2
 Neuromuscular blocking agents: Decrease in BIS value related to attenuation of high-frequency muscle activity across the patient’s forehead.8,17,23,40
 Painful (noxious) stimulation: If analgesia is inadequate, arousal response may be produced within the cerebral cortex.1,2,19
 Sleep: BIS range is lower (20 to 70) during deep sleep, and BIS range is higher (75 to 92) during rapid eye movement (REM) sleep.21
 Hypothermia: Decrease in BIS value.3,22,27
 Cerebral ischemia: Decrease in BIS value.21,26,28,38
 Neurologic injury: Decrease in BIS value3,8,16 depending on location of injury and degree to which overall cerebral metabolism is affected.1,3,18
 Encephalopathic states: Severe anoxic or ischemic encephalopathy (decrease in BIS value).1,3
 Electromyographic (EMG) activity (high-frequency activity from muscle activity across forehead)3,6 may cause increase in BIS value independent of hypnotic state.8,17,19,40
Related posts:
![]() 39: Automated External Defibrillation
39: Automated External Defibrillation
![]() 139: Calculating Doses and Flow Rates and Administering Continuous Intravenous Infusions
139: Calculating Doses and Flow Rates and Administering Continuous Intravenous Infusions
![]() 16: Continuous Venous Oxygen Saturation Monitoring
16: Continuous Venous Oxygen Saturation Monitoring
![]() 117: Bone Marrow Biopsy and Aspiration (Perform)
117: Bone Marrow Biopsy and Aspiration (Perform)
![]() 67: Cardiac Output Measurement Techniques (Invasive)
67: Cardiac Output Measurement Techniques (Invasive)
![]() 35: Invasive Mechanical Ventilation (Through an Artificial Airway): Volume and Pressure Modes
35: Invasive Mechanical Ventilation (Through an Artificial Airway): Volume and Pressure Modes

Full access? Get Clinical Tree


86: Bispectral Index Monitoring