(31.1)
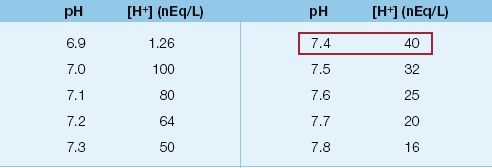
The physiological range of pH and corresponding [H+] is shown in Table 31.1. The normal pH of plasma is indicated as 7.40, which corresponds to a [H+] of 40 nEq/L.
Features of the pH
The relationships in Table 31.1 illustrate 3 unfortunate features of the pH: (a) it is a dimensionless number, which has no relevance in chemical or physiological events, (b) it varies in the opposite direction to changes in [H+], and (c) changes in pH are not linearly related to changes in [H+]. Note that as the pH decreases, the changes in [H+] become gradually larger with each change in pH. This means that changes in pH will have different implications for acid-base balance at different points along the pH spectrum. Although it is unlikely that the pH will be abandoned, it is not a representative measure of the acid-base events in the body.
Table 31.1 pH and Hydrogen Ion Concentration
Hydrogen Ions as a Trace Element
Also evident in Table 31.1 is the fact that [H+] is expressed as nanoequivalents per liter (nEq/L). One nanoequivalent is one-millionth of a milliequivalent (1 nEq = 1×10⁻⁶ mEq), so hydrogen ions are about a million times less dense than the principal ions in extracellular fluid (sodium and chloride), whose concentration is expressed in mEq/L. This gives hydrogen ions the status of a trace element. How can such a small quantity of an ion have all the effects attributed to acidosis and alkalosis? Other trace elements certainly have important biological effects, but it is also possible that changes in the [H+] are just one of several physicochemical changes that are taking place in the extracellular fluid. This would explain why the same degree of acidosis is more life-threatening in lactic acidosis than in ketoacidosis (as described in the next chapter); i.e., the acidosis is not the problem.
Classification of Acid-Base Disorders
According to traditional concepts of acid-base physiology, the [H+] in extracellular fluid is determined by the balance between the partial pressure of carbon dioxide (PCO2) and the concentration of bicarbonate (HCO3) in the fluid. This relationship is expressed as follows (1):
 (31.2)
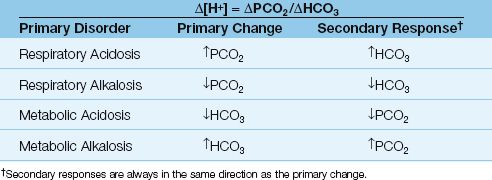
The PCO2/HCO3 ratio identifies the primary acid-base disorders and secondary responses, which are shown in Table 31.2.
Primary Acid-Base Disorders
According to equation 31.2, a change in either the PCO2 or the HCO3 will cause a change in the [H+] of extracellular fluid. When a change in PCO2 is responsible for a change in [H+], the condition is called a respiratory acid-base disorder: an increase in PCO2 is a respiratory acidosis, and a decrease in PCO2 is a respiratory alkalosis. When a change in HCO3 is responsible for a change in [H+], the condition is called a metabolic acid-base disorder: a decrease in HCO3 is a metabolic acidosis, and an increase in HCO3 is a metabolic alkalosis.
Table 31.2 Primary Acid-Base Disorders and Secondary Responses
Secondary Responses
Secondary responses are designed to limit the change in [H+] produced by the primary acid-base disorder, and this is accomplished by changing the other component of the PaCO2/HCO3 ratio in the same direction. For example, if the primary problem is an increase in PaCO2 (respiratory acidosis), the secondary response will involve an increase in HCO3, and this will limit the change in [H+] produced by the increase in PaCO2. Secondary responses should not be called “compensatory responses” because they do not completely correct the change in [H+] produced by the primary acid-base disorder (2). The specific features of secondary responses are described next. The equations described in the next section are included in Figure 31.1.
Responses to Metabolic Acid-Base Disorders
The response to a metabolic acid-base disorder involves a change in minute ventilation that is mediated by peripheral chemoreceptors located in the carotid body at the carotid bifurcation in the neck.
Metabolic Acidosis
The secondary response to metabolic acidosis is an increase in minute ventilation (tidal volume and respiratory rate) and a subsequent decrease in PaCO2. This response appears in 30–120 minutes, and can take 12 to 24 hours to complete (2). The magnitude of the response is defined by the equation below (2).
 (31.3)
Using a normal PaCO2 of 40 mm Hg and a normal HCO3 of 24 mEq/L, the above equation can be rewritten as follows:
 (31.4)
EXAMPLE: For a metabolic acidosis with a plasma HCO3 of 14 mEq/L, the ∅HCO3 is 24 – 14 = 10 mEq/L, the ∅PaCO2 is 1.2×14 = 17 mm Hg, and the expected PaCO2 is 40 – 17 = 23 mm Hg. If the PaCO2 is >23 mm Hg, there is a secondary respiratory acidosis. If the PaCO2 is <23 mm Hg, there is a secondary respiratory alkalosis.
Metabolic Alkalosis
The secondary response to metabolic alkalosis is a decrease in minute ventilation and a subsequent increase in PaCO2. This response is not as vigorous as the response to metabolic acidosis because the peripheral chemoreceptors are not very active under normal conditions, so they are easier to stimulate than inhibit. The magnitude of the response to metabolic alkalosis is defined by the equation below (2)
 (31.5)
Using a normal PaCO2 of 40 mm Hg and a normal HCO3 of 24 mEq/L, the above equation can be rewritten as follows:
 (31.6)
EXAMPLE: For a metabolic alkalosis with a plasma HCO3 of 40 mEq/L, the ∅HCO3 is 40 – 24 = 16 mEq/L, the ∅PaCO2 is 0.7×16 = 11 mm Hg, and the expected PaCO2 is 40 + 11 = 51 mm Hg. This is only a borderline elevation in PaCO2, and it demonstrates the relative weakness of the response to metabolic alkalosis.
Responses to Respiratory Acid-Base Disorders
The secondary response to changes in PaCO2 occurs in the kidneys, where HCO3 absorption in the proximal tubes is adjusted to produce the appropriate change in plasma HCO3. This renal response is relatively slow, and can take 2 or 3 days to reach completion. Because of the delay in the secondary response, respiratory acid-base disorders are separated into acute and chronic disorders.
Acute Respiratory Disorders
Acute changes in PaCO2 have a small effect on the plasma HCO3, as indicated in the following two equations (2).
For acute respiratory acidosis:
 (31.7)
For acute respiratory alkalosis:
 (31.8)
EXAMPLE: For an acute increase in PaCO2 to 60 mm Hg, the ∅HCO3 is 0.1×20 = 2 mEq/L for an acute respiratory acidosis, and 0.2×20 = 4 mEq/L for an acute respiratory alkalosis. Neither of these changes would be recognized as significant.
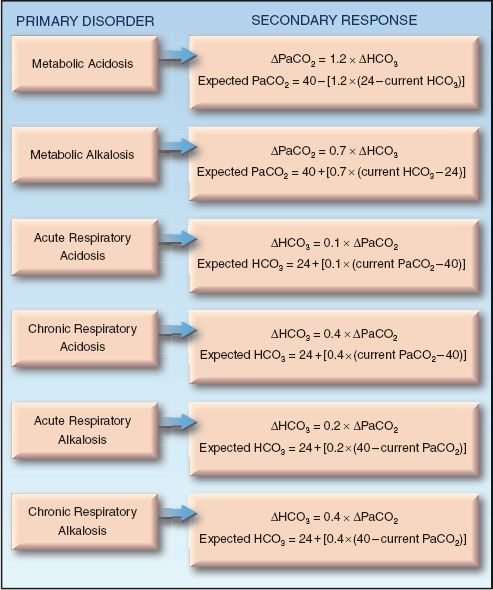
FIGURE 31.1 Predictive equations for evaluating secondary responses to primary acid-base disorders. All equations are from Reference 2.
Chronic Respiratory Disorders
The renal response to an increase in PaCO2 is an increase in HCO3 reabsorption in the proximal renal tubules, which raises the plasma HCO3 concentration. The response to a decrease in PaCO2 is a decrease in renal HCO3 reabsorption, which lowers the plasma HCO3 concentration. The magnitude of this response is similar, regardless of the directional change in PaCO2, so the equation below applies to both chronic respiratory acidosis and alkalosis.
 (31.9)
Using a normal PaCO2 of 40 mm Hg and a normal HCO3 of 24 mEq/L, the above equation can be rewritten as follows:
For chronic respiratory acidosis:
 (31.10)
For chronic respiratory alkalosis:
 (31.11)
EXAMPLE: For an increase in PaCO2 to 60 mm Hg that persists for at least a few days, the ∅PaCO2 is 60 – 40 = 20 mm Hg, the ∅HCO3 is 0.4×20 = 8 mEq/L, and the expected HCO3 is 24 + 8 = 32 mEq/L.
STEPWISE APPROACH TO ACID-BASE ANALYSIS
The following is a structured, rule-based approach to the diagnosis of primary, secondary, and mixed acid-base disorders using the relationships between the [H+], PCO2, and HCO3 concentration described previously. Several examples are included as instructional aids. The reference ranges for arterial pH, PCO2, and HCO3 are shown below.
pH = 7.36–7.44
PCO2 = 36–44 mm Hg
HCO3 = 22–26 mEq/L
Stage I: Identify the Primary Acid-Base Disorder
In the first stage of the approach, the PaCO2 and pH are used to identify the primary acid-base disorder.
| Rule 1: | If the PaCO2 and/or the pH is outside the normal range, there is an acid-base disorder. |
| Rule 2: | If the PaCO2 and pH are both abnormal, compare the directional change. |
| 2a. | If the PaCO2 and pH change in the same direction, there is a primary metabolic acid-base disorder. |
| 2b. | If the PaCO2 and pH change in opposite directions, there is a primary respiratory acid-base disorder. |
EXAMPLE: Consider a case where the arterial pH = 7.23 and the PaCO2 = 23 mm Hg. The pH and PaCO2 are both reduced (indicating a primary metabolic disorder) and the pH is low (indicating an acidosis), so the diagnosis is a primary metabolic acidosis.
| Rule 3: | If only the pH or PaCO2 is abnormal, the condition is a mixed metabolic and respiratory disorder (i.e., equal and opposite disorders). |
| 3a. | If the PaCO2 is abnormal, the directional change in PaCO2 identifies the type of respiratory disorder (e.g., high PaCO2 indicates a respiratory acidosis), and the opposing metabolic disorder. |
| 3b. | If the pH is abnormal, the directional change in pH identifies the type of metabolic disorder (e.g., low pH indicates a metabolic acidosis) and the opposing respiratory disorder. |
EXAMPLE: Consider a case where the arterial pH = 7.38 and the PaCO2 = 55 mm Hg. Only the PaCO2 is abnormal, so there is a mixed metabolic and respiratory disorder. The PaCO2 is elevated, indicating a respiratory acidosis, so the metabolic disorder must be a metabolic alkalosis. Therefore, this condition is a mixed respiratory acidosis and metabolic alkalosis. Both disorders are equivalent in severity because the pH is normal.
Stage II: Evaluate the Secondary Responses
The second stage of the approach is for cases where a primary acid-base disorder has been identified in Stage I. (If a mixed acid-base disorder was identified in Stage I, go directly to Stage III). The goal in Stage II is to determine if there is an additional acid-base disorder.
| Rule 4: | For a primary metabolic disorder, if the measured PaCO2 is higher than expected, there is a secondary respiratory acidosis, and if the measured PaCO2 is less than expected, there is a secondary respiratory alkalosis. |
EXAMPLE: Consider a case where the PaCO2 = 23 mm Hg, the pH = 7.32, and the HCO3 = 16 mEq/L. The pH and PCO2 change in the same direction, indicating a primary metabolic disorder, and the pH is acidemic, so the disorder is a primary metabolic acidosis. Using equations 31.3 and 31.4, the ∅PaCO2 is 1.2×(24 – 16) = 10 mm Hg (rounded off), and the expected PaCO2 is 40 – 10 = 30 mm Hg. The measured PaCO2 (23 mm Hg) is lower than the expected PaCO2, so there is an additional respiratory alkalosis. Therefore, this condition is a primary metabolic acidosis with a secondary respiratory alkalosis.
| Rule 5: | For a primary respiratory disorder, a normal or near-normal HCO3 indicates that the disorder is acute. |
| Rule 6: | For a primary respiratory disorder where the HCO3 is abnormal, determine the expected HCO3 for a chronic respiratory disorder. |
| 6a. | For a chronic respiratory acidosis, if the HCO3 is lower than expected, there is an incomplete renal response, and if the HCO3 is higher than expected, there is a secondary metabolic alkalosis. |
| 6b. | For a chronic respiratory alkalosis, if the HCO3 is higher than expected, there is an incomplete renal response, and if the HCO3 is lower than expected, there is a secondary metabolic acidosis. |
EXAMPLE: Consider a case where the PaCO2 = 23 mm Hg, the pH = 7.54, and the HCO3 = 38 mEq/L. The PaCO2 and pH change in opposite directions, indicating a primary respiratory disorder, and the pH is alkaline, so the disorder is a primary respiratory alkalosis. The HCO3 is abnormal, indicating that this is not an acute respiratory alkalosis. Using Equations 31.9 and 31.11 for a chronic respiratory alkalosis, the ∅PCO2 is 40 – 23 = 17 mm Hg, the ∅HCO3 is 0.4×17 = 7 mEq/L, and the expected HCO3 is 24 + 7 = 31 mEq/L. The measured HCO3 is the same as expected for a chronic respiratory alkalosis, so this condition is a chronic respiratory alkalosis with an appropriate (completed) renal response. If the measured HCO3 was less than 31 mEq/L, this condition would be a chronic respiratory alkalosis with an incomplete renal response, and if the measured HCO3 was higher than 31 mEq/L, this would indicate a secondary metabolic alkalosis.
Stage III: Use The “Gaps” to Evaluate a Metabolic Acidosis
The final stage of this approach is for patients with a metabolic acidosis, where the use of measurements called gaps can help to uncover the underlying cause of the acidosis. These are described in the next section.
THE GAPS
There are numerous potential sources of a metabolic acidosis in critically ill patients, and the measurements described in this section are designed to help in the search for the culprit.
The Anion Gap
The anion gap is a rough estimate of the relative abundance of unmeasured anions, and is used to determine if a metabolic acidosis is due to an accumulation of non-volatile acids (e.g., lactic acid) or a primary loss of bicarbonate (e.g., diarrhea) (6,7).
Determinants
To achieve electrochemical balance, the concentration of negatively charged anions must equal the concentration of positively charged cations. This electrochemical balance is expressed in the equation shown below using electrolytes that are routinely measured, including sodium (Na), chloride (CL), and bicarbonate (HCO3), as well as the unmeasured cations (UC) and unmeasured anions (UA).
 (31.12)
Rearranging the terms in this equation yields the following relationships:
 (31.13)
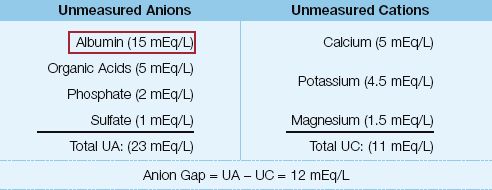
The difference (UA – UC) is a measure of the relative abundance of unmeasured anions, and is called the anion gap (AG).
 (31.14)
Reference Range: The original reference range for the AG was 12±4 mEq/L (range = 8 to 16 mEq/L) (7). With subsequent improvements in automated systems that measure serum electrolytes, the reference range for the AG has decreased to 7±4 mEq/L (range = 3 to 11 mEq/L) (8).
Influence of Albumin
The unmeasured anions and cations that normally contribute to the anion gap are shown in Table 31.3. Note that albumin is the principal unmeasured anion, and the principal determinant of the anion gap. Albumin is a weak (i.e., poorly dissociated) acid that contributes about 3 mEq/L to the AG for each 1 g/dL of albumin in plasma (at a normal pH) (3). A low albumin level in plasma will lower the AG, and this could mask the presence of an unmeasured anion (e.g., lactate) that is contributing to a metabolic acidosis. Since hypoalbuminemia is present in as many as 90% of ICU patients (9), the following formula for the “corrected AG” (AGc) has been proposed to include the contribution of albumin:
 (31.15)
(4.5 represents the normal concentration of albumin in plasma). For a patient with an AG of 10 mEq/L and a plasma albumin of 2 g/dL, the AGc is 10 + (2.5×2.5) = 16 mEq/L, which represents a 60% increase in the AG.
Table 31.3 Determinants of the Anion Gap
Using the Anion Gap
The AG can be used to identify the underlying mechanism of a metabolic acidosis, which then helps to identify the underlying clinical condition. An elevated AG occurs when there is an accumulation of fixed or non-volatile acids (e.g., lactic acidosis), while a normal AG occurs when there is a primary loss of bicarbonate (e.g., diarrhea) (7). Table 31.4 shows the causes of metabolic acidosis grouped according to the AG.
HIGH AG: Common causes of high AG metabolic acidosis are lactic acidosis, diabetic ketoacidosis, and advanced renal failure (where there is loss of H+ secretion in the distal tubules of the kidneys). Also included are toxic ingestions of methanol (which produces formic acid), ethylene glycol (which produces oxalic acid), and salicylates (which produce salicylic acid) (10).
Table 31.4 Classification of Metabolic Acidosis with the Anion Gap (AG)
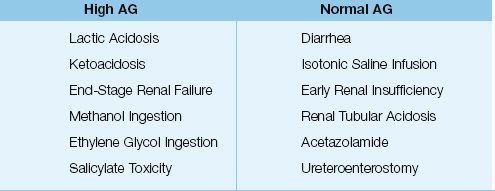
NORMAL AG: Common causes of a normal AG metabolic acidosis are diarrhea, saline infusion (see Figure 12.3), and early renal failure (where there is loss of bicarbonate reabsorption in the proximal tubules). The loss of HCO3 is counterbalanced by a gain of chloride ions to maintain electrical charge neutrality; hence the term hyperchloremic metabolic acidosis is used for normal AG metabolic acidoses. (In high AG metabolic acidoses, the remaining anions from the dissociated acids balance the loss of HCO3, so there is no associated hyperchloremia.)
RELIABILITY The AG has shown a limited ability to detect non-volatile acids, and there are several reports where the AG was normal in patients with lactic acidosis (11,12). The poor performance of the AG may be due to the confounding influence of albumin, which was not considered in early studies of the AG. A recent study shows that the albumin-corrected AG (AGc) provides a more accurate assessment of metabolic acidosis than the AG (13).
The Gap-Gap Ratio
In the presence of a high AG metabolic acidosis, it is possible to detect another metabolic acid-base disorder (a normal AG metabolic acidosis or a metabolic alkalosis) by comparing the AG excess (the difference between the measured and normal AG) to the HCO3 deficit (the difference between the measured and normal HCO3 in plasma). This is accomplished with the equation shown below, which includes 12 mEq/L for the normal AG and 24 mEq/L for the normal HCO3 in plasma.
 (31.16)
This ratio is sometimes called the gap-gap ratio because it involves two gaps (the AG excess and the HCO3 deficit). Some applications of the gap-gap ratio are described next.
Mixed Metabolic Acidoses
In metabolic acidoses caused by non-volatile acids (high AG metabolic acidosis), the decrease in serum HCO3 is equivalent to the increase in AG, and the gap-gap (AG Excess/HCO3 deficit) ratio is unity or 1. However, if there is a second acidosis that has a normal AG, the decrease in HCO3 is greater than the increase in AG, and the gap-gap ratio falls below unity (<1). Therefore, in the presence of a high AG metabolic acidosis, a gap-gap ratio <1 indicates the co-existence of a normal AG (hyperchloremic) metabolic acidosis (6,14).
DIABETIC KETOACIDOSIS: A popular question on the medicine boards is a case where the management of a patient with diabetic ketoacidosis (DKA) is associated with improvement in the blood glucose and the clinical condition of the patient, but the acidosis persists, and you are asked what to do (more insulin, more fluids, etc). The answer lies in the gap-gap ratio; i.e., DKA presents with a high AG metabolic acidosis, but the aggressive infusion of isotonic saline during the initial management creates a hyperchloremic (normal AG) metabolic acidosis, which replaces the high AG acidosis as the ketoacids are cleared. In this situation, the serum bicarbonate remains low, but the gap-gap ratio falls below 1 as the acidosis switches from a high AG to a normal AG acidosis (15). Therefore, monitoring the serum HCO3 alone will create a false impression that the DKA is not resolving, while the gap-gap ratio provides an accurate measure of the acid-base status of the patient.
Metabolic Acidosis and Alkalosis
When alkali is added in the presence of a high AG acidosis, the decrease in serum bicarbonate is less than the increase in AG, and the gap-gap is greater than unity (>1). Therefore, in the presence of a high AG metabolic acidosis, a gap-gap >1 indicates the co-existence of a metabolic alkalosis. This is an important consideration because metabolic alkalosis is common in ICU patients (from the frequent use of nasogastric suction and diuretics).
A FINAL WORD
For more than 100 years, the evaluation of acid-base balance has been based on a single reaction sequence (which is shown below), and a single determinant of plasma pH (the PCO2/HCO3 ratio).

This approach is appealing because of its simplicity, but as Whitehead advises in the introductory quote, the simplicity of this approach is also a reason for “distrust.” The following are a few reasons to distrust the traditional view of acid-base balance.
1. The use of the PCO2-HCO3 relationship to identify acid-base disorders has two flaws:
a. The PCO2 and HCO3 are both dependent variables, and thus it is not possible detect acid-base conditions that operate independent of these variables.
b. Since the CO2 in plasma is present primarily as HCO3, it is difficult to establish an independent identity for HCO3.
2. Bicarbonate does not act as a buffer in the physiological pH range (which is demonstrated in the next chapter). The plasma [H+] is a function of the anionic charge equivalence of plasma proteins (which act as the buffers in plasma), and is not directly related to the plasma [HCO3] (16).
A novel view of acid-base balance that challenges traditional concepts was introduced by Peter Stewart (a Canadian physiologist working at Brown) about 30 years ago, and I have included a textbook, and one of Stewart’s original papers on the subject (17), for your interest.
REFERENCES
Books
Rose BD, Post T, Stokes J. Clinical Physiology of Acid-Base and Electrolyte Disorders. 6th ed. New York:McGraw-Hill, 2013.
Kellum JA, Elbers WG, ed. Stewart’s Textbook of Acid-Base. 2nd ed. Amsterdam: AcidBase.org, 2009.
Gennari FJ, Adrogue HJ, Galla JH, Maddias N, eds. Acid-Base Disorders and Their Treatment. Boca Raton: CRC Press, 2005.
Reviews
1. Adrogue HJ, Gennari J, Gala JH, Madias NE. Assessing acid-base disorders. Kidney Int 2009; 76:1239–1247.
2. Adrogue HJ, Madias NE. Secondary responses to altered acid-base status: The rules of engagement. J Am Soc Nephrol 2010; 21:920–923.
3. Kellum JA. Disorders of acid-base balance. Crit Care Med 2007; 35:2630–2636.
4. Whittier WL, Rutecki GW. Primer on clinical acid-base problem solving. Dis Mon 2004; 50:117–162.
5. Fencl V, Leith DE. Stewart’s quantitative acid-base chemistry: applications in biology and medicine. Respir Physiol 1993; 91:1–16.
6. Narins RG, Emmett M. Simple and mixed acid-base disorders: a practical approach. Medicine 1980; 59:161–187.
Selected References
7. Emmet M, Narins RG. Clinical use of the anion gap. Medicine 1977; 56:38–54.
8. Winter SD, Pearson JR, Gabow PA, et al. The fall of the serum anion gap. Arch Intern Med 1990; 150:311–313.
9. Figge J, Jabor A, Kazda A, Fencl V. Anion gap and hypoalbuminemia. Crit Care Med 1998; 26:1807–1810.
10. Judge BS. Metabolic acidosis: differentiating the causes in the poisoned patient. Med Clin N Am 2005; 89:1107–1124.
11. Iberti TS, Liebowitz AB, Papadakos PJ, et al. Low sensitivity of the anion gap as a screen to detect hyperlactatemia in critically ill patients. Crit Care Med 1990; 18:275–277.
12. Schwartz-Goldstein B, Malik AR, Sarwar A, Brandtsetter RD. Lactic acidosis associated with a normal anion gap. Heart Lung 1996; 25:79–80.
13. Mallat J, Barrailler S, Lemyze M, et al. Use of sodium chloride difference and corrected anion gap as surrogates of Stewart variables in critically ill patients. PLoS ONE 2013; 8:e56635. (Open access jounal, accessed at www.plosone.org on 4/11/2013.)
14. Haber RJ. A practical approach to acid-base disorders. West J Med 1991; 155:146–151.
15. Paulson WD. Anion gap-bicarbonate relationship in diabetic ketoacidosis. Am J Med 1986; 81:995–1000.
16. Stewart PA. Whole-body acid-base balance. In :Kellum JA, Elbers PWG, eds. Stewart’s Textbook of Acid Base. 2nd ed. Amsterdam: AcidBase.org, 2009:181–197.
17. Stewart PA. Modern quantitative acid-base chemistry. Can J Physiol Pharmacol 1983; 61:1444–1461.


Full access? Get Clinical Tree


