Plasma vs. Interstitial Fluid
Extracellular fluid accounts for about 40% of the total body fluid, and is composed of extravascular (interstitial) and intravascular (plasma) fluid compartments. Comparison of interstitial fluid and plasma volumes in Table 11.1 shows that plasma volume is about 25% of interstitial fluid volume. This relationship is important for understanding the volume effects of sodium-based (saline) fluids; i.e., since sodium equilibrates throughout the extracellular fluid, 75% of infused saline solutions will distribute in the interstitial fluid, and 25% will distribute in the plasma. Thus, the principal effect of saline solutions is to enhance the interstitial fluid volume, not the plasma volume (2).
Blood Loss
Compensatory Responses
Acute blood loss triggers two compensatory responses aimed at restoring volume deficits (3). The earliest response involves movement of interstitial fluid into the bloodstream. This transcapillary refill can add as much as one liter to the plasma volume, but it leaves an interstitial fluid deficit. The second response involves activation of the renin–angiotensin–aldosterone system (from decreased renal perfusion), which results in sodium conservation by the kidneys. The retained sodium will primarily enhance the interstitial volume, and thus will help to replace the interstitial fluid deficits created by transcapillary refill. These two responses can fully compensate for the loss of 15% to 20% of the blood volume (3).
Severity of Blood Loss
The American College of Surgeons has proposed the following classification system for acute blood loss (4).
CLASS I. Loss of ≤15% of the blood volume (or ≤10 mL/kg). This degree of blood loss is usually fully compensated by transcapillary refill. Be-cause blood volume is maintained, clinical findings are minimal or absent, and volume resuscitation is not necessary (3).
CLASS II. Loss of 15–30% of the blood volume (or 10–20 mL/kg). This represents the compensated phase of hypovolemia, where blood pressure is maintained by systemic vasoconstriction (5). Postural changes in pulse rate and blood pressure may be evident, but these findings are inconsistent (see later), and the hypovolemia can be clinically silent. The vasoconstrictor response to hypovolemia is most intense in the splanchnic circulation, and splanchnic hypoperfusion can lead to disruption of the intestinal mucosa and invasion of the bloodstream with enteric pathogens (6).
CLASS III. Loss of 30–45% of the blood volume (or 20–30 mL/kg). This marks the onset of decompensated blood loss or hemorrhagic shock, where the vasoconstrictor response is no longer able to sustain blood pressure and organ perfusion. The clinical consequences can include supine hy-potension, evidence of impaired organ perfusion (e.g., cool extremities, oliguria, depressed consciousness), and evidence of anaerobic metabolism (i.e., lactate accumulation in blood).
CLASS IV. Loss of >45% of blood volume (or >30 mL/kg). This degree of blood loss results in profound hemorrhagic shock, which may be irreversible. Clinical manifestations include multiorgan failure and severe metabolic (lactic) acidosis. This category includes massive blood loss, which is described later in the chapter.
ASSESSMENT OF BLOOD VOLUME
The importance of an accurate assessment of the intravascular volume is matched by the difficulties encountered, and the clinical evaluation of intravascular volume is so flawed that it has been called a “comedy of errors” (7).
Vital Signs
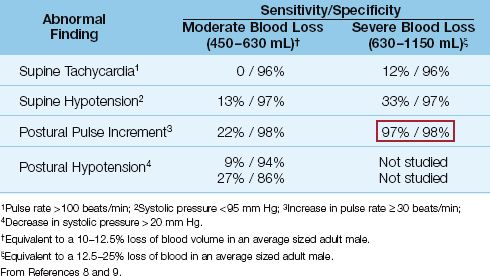
The changes in pulse rate and blood pressure that occur in acute hypovolemia are listed in Table 11.2, along with the reported sensitivities and specificities at two levels of blood loss (8,9). Supine tachycardia and hypotension are absent in a large majority of patients with blood volume deficits up to 1.1 liters (up to a 25% loss of blood volume in average sized males). The absence of tachycardia is contrary to traditional beliefs, yet bradycardia may be more prevalent in patients with acute blood loss (8).
Table 11.2 Operating Characteristics of Vital Signs in the Detection of Hypovolemia
Postural Changes
Moving from the supine to the standing position causes a shift of 7 to 8 mL/kg of blood to the lower extremities (8). In healthy subjects, this change in body position is associated with a small increase in heart rate (about 10 beats/min) and a small decrease in systolic blood pressure (about 3 to 4 mm Hg). These changes can be exaggerated in hypo-volemia. The expected postural changes in hypovolemia include an increment in pulse rate of at least 30 beats/minute, and a decrease in systolic blood pressure that exceeds 20 mm Hg. As shown in Table 11.2, these postural changes are uncommon when blood loss is less than 630 mL (≤12% decrease in blood volume), but above this level, the postural pulse increment is a sensitive and specific marker of acute blood loss (as indicated by the boxed numbers in Table 11.2).
In summary, vital signs provide little benefit in the evaluation of hypovolemia, particularly in excluding the diagnosis. Supine hypotension may suggest the presence of profound hypovolemia, but this condition should be accompanied by other more reliable markers of severe volume loss (e.g., diminished urine output, elevated serum lactate levels).
Hematocrit
The use of the hematocrit (and hemoglobin concentration) to evaluate the presence and severity of acute blood loss is both common and inappropriate. Changes in hematocrit show a poor correlation with blood volume deficits and erythrocyte deficits in acute hemorrhage (10), and the reason for this discrepancy is demonstrated in Figure 11.1. Acute blood loss involves the loss of whole blood, which results in proportional decreases in the volume of plasma and erythrocytes. As a result, acute blood loss results in a decrease in blood volume, but not a decrease in hematocrit. (There is a small dilutional effect from transcapillary refill in acute blood loss, but this is usually not enough to cause a significant decrease in hematocrit.) In the absence of volume resuscitation, the hematocrit will eventually decrease because hypovolemia activates the renin-angiotensin-aldosterone system, and the renal retention of sodium and water that follows will have a dilutional effect on the hematocrit. This process begins 8 to 12 hours after acute blood loss, and can take a few days to become fully established.
Influence of Fluid Resuscitation
The influence of fluid resuscitation on the hematocrit is demonstrated in Figure 11.1. Infusion of isotonic saline augments the plasma volume but not the red cell volume, resulting in a dilutional decrease in the hematocrit. All asanguinous fluids (i.e., colloid and crystalloid fluids) have a similar dilutional effect on the hematocrit (11), and the volume of fluid infused will determine the magnitude of the decrease in hematocrit. Resuscitation with erythrocyte-containing fluids will have a different effect. This is demonstrated in Figure 11.1 using whole blood as the resuscitation fluid. In this situation, erythrocyte and plasma volumes are increased proportionately, so there is no change in hematocrit. This demonstrates how, in the early hours after acute blood loss, the hematocrit is a reflection of the resuscitation effort (the type and volume of fluids infused), and not the extent of blood loss.
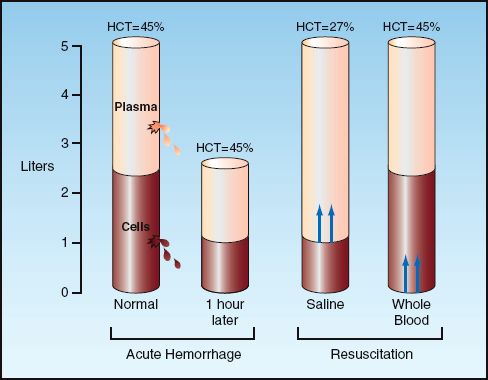
FIGURE 11.1 Influence of acute hemorrhage and fluid resuscitation on blood volume and hematocrit. See text for explanation
Invasive Measures
Cardiac Filling Pressures
Cardiac filling pressures (i.e., central venous pressure and pulmonary artery occlusion pressure) have traditionally played a prominent role in the evaluation of ventricular volume and circulating blood volume. However, neither role is justified because experimental studies have shown a poor correlation between cardiac filling pressures and ventricular end-diastolic volume (see Figure 9.3 in Chapter 9) (12), and even less of a correlation between cardiac filling pressures and circulating blood volume (13–15). The latter observation is demonstrated in Figure 11.2, which shows the relationship between paired measurements of central venous pressure (CVP) and circulating blood volume in a group of postoperative patients. The scattered distribution of the data points illustrates the lack of a significant relationship between the two measurements, which is confirmed by the correlation coefficient (r) and p value in the upper left corner of the graph. Similar results have been reported in other clinical studies (13,15). The consistent lack of correlation between CVP and blood volume measurements has prompted the recommendation that the CVP should never be used to make decisions regarding fluid management (13).
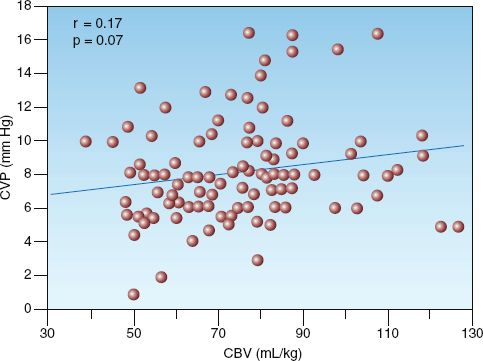
FIGURE 11.2 Scatter plot showing 112 paired measurements of circulating blood volume (CBV) and central venous pressure (CVP) in a group of postoperative patients. Correlation coefficient (R) and p value indicate no significant relationship between CVP and blood volume. Redrawn from Reference 14.
Systemic O2 Transport
The systemic O2 transport parameters are described in detail in Chapter 10. The typical pattern with hemorrhage or hypovolemia is a decrease in systemic O2 delivery (DO2) with an increase in O2 extraction (SaO2 – SvO2). Systemic O2 consumption (VO2) is normal in cases of compensated hypovolemia (when the increase in O2 extraction fully compensates for the decrease in DO2, as shown in Figure 10.5), and the VO2 is abnormally low in cases of hypovolemic shock. It is usually not possible to monitor these parameters in cases of acute hemorrhage, and chemical markers of tissue dysoxia are used to determine if acute blood loss results in hemorrhagic shock.
Chemical Markers of Dysoxia
Active hemorrhage can reduce systemic O2 delivery to levels that are un-able to sustain aerobic energy metabolism. The resulting oxygen-limited energy metabolism, also known as dysoxia, is accompanied by enhanced production of lactic acid via anaerobic glycolysis. The clinical expression of this condition is hemorrhagic shock, which is characterized by an elevated lactate concentration in blood. Since this condition can appear after loss of only 30% of the blood volume (1.5 liters in an average sized male), cases of active hemorrhage are monitored routinely for evidence of hemorrhagic shock using serum lactate concentrations or arterial base deficit. These two markers of impaired tissue oxygenation are described in detail in Chapter 10, and are mentioned only briefly here.
Serum Lactate
As just mentioned, an elevated serum lactate level in the setting of acute blood loss is presumptive evidence of hemorrhagic shock. The possibility that lactate accumulation in low flow states is the result of reduced lactate clearance is not supported by clinical studies showing equivalent rates of lactate removal in healthy adults and patients with cardiogenic shock (16). Although the threshold for an elevated serum lactate level is 2 mM/L, lactate levels ≥4 mM/L are more predictive of increased mortality (17), so a threshold of 4 mM/L is often used to identify life-threatening elevations of serum lactate.
LACTATE CLEARANCE: According to the bar graphs in Figure 10.6 (Chapter 10), the mortality rate in critically ill patients is not only related to the initial lactate level, but is also a function of the rate of decline in lactate levels after treatment is initiated (lactate clearance). The panel on the right in Figure 10.6 indicates that mortality is lowest when lactate levels return to normal within 24 hours. In one study of trauma victims with hemorrhagic shock, there were no deaths when lactate levels returned to normal within 24 hours, while 86% of the patients died when lactate levels remained elevated after 48 hours (18). Therefore, normalization of lactate levels within 24 hours can be used as an end-point of resuscitation for hemorrhagic shock (see later).
Arterial Base Deficit
Arterial base deficit is a non-specific marker of metabolic acidosis that was adopted as a surrogate measure of lactic acidosis because of its availability in blood gas reports. However, lactate-specific analyzers are now routinely available that provide lactate measurements within a few minutes, and this obviates the need for arterial base deficit in the evaluation and management of hemorrhagic shock.
Fluid Responsiveness
Concern about the liberal use of fluids in critical care management ( which creates risks without apparent rewards) led to the practice of evaluating patients for fluid responsiveness before infusing fluids empirically. This practice is not aimed at uncovering occult hypovolemia, but is an attempt to limit volume therapy to those who are likely to respond. It is primarily intended for patients who have an uncertain intravascular volume and are hemodynamically unstable. Mechanical methods of modulating cardiac preload have been proposed for evaluating fluid responsiveness (19), but these methods can be problematic, and fluid challenges remain the recommended method for evaluating fluid responsiveness (20).
Fluid Challenges
There is no standard protocol for fluid challenges. The principal concern is to ensure that the fluid challenge will increase ventricular preload (i.e., end-diastolic volume), and the rate of infusion is more important than the volume infused for achieving this goal (21). The fluid challenge favored in clinical studies is 500 mL of isotonic saline infused over 10–15 minutes (22). Fluid responsiveness is evaluated by the response of the cardiac output (which can be measured noninvasively using Doppler ultrasound techniques). An increase in cardiac output of at least 12–15% after a fluid challenge is used as evidence of fluid responsiveness (23). About 50% of critically ill patients are fluid responsive when tested in this manner (21,23). This percentage is much lower than expected, and may indicate that fluid challenges often fall short of augmenting ventricular preload.
PASSIVE LEG RAISING: Elevating the legs to 45° above the horizontal plane while in the supine position will move 150 mL to 750 mL of blood out of the legs and towards the heart (19), thereby serving as a “built-in” fluid challenge. This maneuver augments aortic blood flow within 30 seconds (22), and an increase in flow rate of 10–15% predicts fluid responsiveness with a sensitivity and specificity of 90% (23). Passive leg raising is recommended as an alternative to fluid challenges when volume restriction is desirable. It is not advised in patients with increased intra-abdominal pressure because the hemodynamic effects are attenuated or lost (24).
Measuring Blood Volume
Blood volume measurements have traditionally required too much time to perform to be clinically useful in an ICU setting, but this has changed with the introduction of a semiautomated blood volume analyzer (Daxor Corporation, New York, NY) that provides blood volume measurements is less than an hour. The information in Figure 11.3 was provided by measurements obtained with this device in a surgical ICU (25). In this case, blinded measurements of blood, red cell, and plasma volumes were performed in patients with circulatory shock who were managed with pulmonary artery catheters, and the results show that blood and plasma volumes were considerably higher than normal. When blood volume measurements were made available for patient care, 53% of the measurements led to a change in fluid management, and this was associated with a significant decrease in mortality rate (from 24% to 8%) (25). These results will require corroboration, but they highlight the limitations of the clinical assessment of blood volume, and the potential for improved outcomes when blood volume measurements are utilized for fluid management.
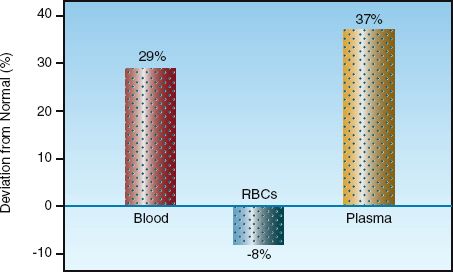
FIGURE 11.3 Deviations from normal for blood, plasma, and red cell volumes in patients with circulatory shock being managed with pulmonary artery catheters. Data from Reference 25.
INFUSING FLUIDS
The steady flow of fluids through small, rigid tubes is described by the Hagen-Poiseuille equation shown below (26).
 (11.1)
This equation states that steady flow (Q) through a rigid tube is directly related to the driving pressure (∅P) for flow and the fourth power of the inner radius (r) of the tube, and is inversely related to the length (L) of the tube and the viscosity (∝) of the infusate. These relationships also de-scribe fluid flow through vascular catheters, as presented next.
Central vs. Peripheral Catheters
There is a tendency to cannulate the large central veins for volume resuscitation because of the perception that larger veins allow more rapid infusion of fluids. However, infusion rates are determined by the dimensions of the catheter, not the size of the vein. The influence of catheter dimensions on flow rates is described in detail in Chapter 1. According to the Hagen Poiseuille equation, infusion rates will be higher in shorter or larger bore catheters. This is demonstrated in Figure 11.4, which shows the gravity-driven flow of water through short, peripheral catheters and a longer, triple-lumen central venous catheter. Flow in the peripheral catheters is at least 4 times greater than flow in the lumen of equivalent diameter in the central venous catheter. This demonstrates why short, large-bore peripheral catheters are preferred to central venous catheters for aggressive volume resuscitation.
Introducer Sheaths
The resuscitation of trauma victims sometimes requires infusion of more than 5 liters in the first hour (>83 mL/min) (27), and resuscitation using more than 50 liters in one hour has been reported (28). Because flow increases with the fourth power of the radius of a catheter, very rapid flow rates are best achieved with large-bore introducer sheaths used as conduits for pulmonary artery catheters (see Figure 8.1). These sheaths can be used as stand-alone infusion catheters, and are available in sizes of 8.5 French (2.7 mm outside diameter) or 9 French (3 mm outside diameter). Flow through introducer sheaths can reach 15 mL/sec (900 mL/min or 54 L/hr), which is only slightly less than the maximum flow (18 mL/sec) through standard (3 mm diameter) intravenous tubing (29). Some introducer sheaths have an additional side infusion port on the hub (see Figure 8.1), but the flow capacity of this port is only 25% of the flow capacity of the introducer sheath (29), so it should be bypassed for rapid infusion rates. Introducer sheaths are available without side infusion ports (e.g., Cook Access Plus, Cook Critical care), and these are preferred for rapid infusion rates.
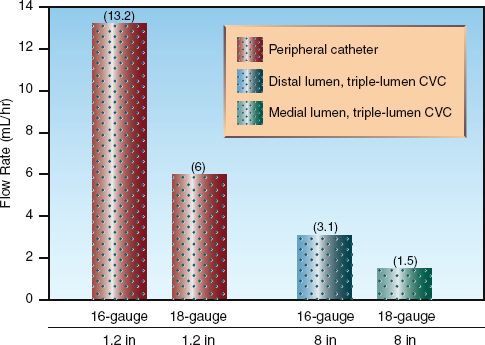
FIGURE 11.4 The influence of catheter dimensions on the gravity-driven infusion rate of water. The triple-lumen central venous catheter (CVC) is a popular size (7 French, 20 cm in length). Flow rates from Table 1.2 and Table 1.3 in Chapter 1.
Infusing Packed Red Blood Cells
Whole blood is not available for replacement of blood loss, and erythrocyte losses are replaced with stored units of concentrated erythrocytes called packed red blood cells. Each unit of packed RBCs has a hematocrit of 55% to 60%, which imparts a high viscosity (see Table 9.2 for the relationship between hematocrit and blood viscosity). As a result, packed RBCs can flow sluggishly unless diluted with saline (as predicted in the Hagen-Poiseuille equation).
The influence of dilution with isotonic saline on the infusion rate of packed RBCs is shown in Figure 11.5 (30). When infused alone, the flow rate of packed RBCs through average sized (18-gauge or 20-gauge) peri-pheral catheters is 3–5 mL/min, which means that one unit of undiluted packed RBCs (which has a volume of about 350 mL) can be infused over 70–117 minutes (about 1–2 hours). This is sufficient for replacing erythrocyte losses in hemodynamically stable patients, but more rapid flow rates may be needed for patients with active bleeding. Figure 11.5 shows that dilution of packed RBCs with 100 mL of isotonic saline results in 7-fold to 8-fold increases in infusion rates, while dilution with 250 mL saline increases flow rates over 10-fold. At the highest infusion rate of 96 mL/min in the 16- gauge catheter, one unit of packed RBCs (350 mL plus 250 mL saline) can be infused in 6–7 minutes. More rapid rates require pressurized infusions, which can increase infusion rates to 120 mL/min using a 16-gauge catheter (30).
RESUSCITATION STRATEGIES
The immediate goal of resuscitation for acute blood loss is to support oxygen delivery (DO2) to vital organs. The determinants of DO2 are identified in the following equation (the derivation of this equation is described in Chapter 10):
 (11.2)
Acute blood loss affects two components of this equation: cardiac output (CO) and hemoglobin concentration in blood, [Hb]. Therefore, the immediate goals of resuscitation are to promote cardiac output and maintain an adequate [Hb]. (Other goals will emerge as we proceed.)
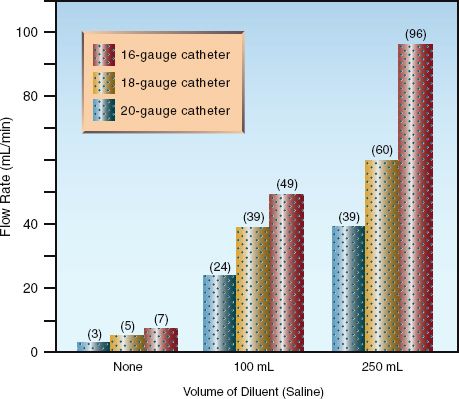
FIGURE 11.5 Influence of dilution with isotonic saline on the gravity-driven infusion rate of erythrocyte concentrates (packed red blood cells) through peripheral catheters. Data from Reference 26.
Promoting Cardiac Output
The consequences of a low cardiac output are far more threatening than the consequences of anemia, so the first priority in the bleeding patient is to support cardiac output.
Resuscitation Fluids
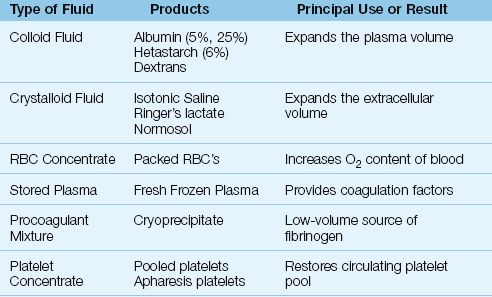
The different types of resuscitation fluids are shown in Table 11.3. The fluids used to promote cardiac output are crystalloid fluids and colloid fluids. Plasma is used to provide clotting factors, and is not used as a volume expander. The distinction between crystalloid and colloid fluids is briefly described below.
1. Crystalloid fluids are sodium-rich electrolyte solutions that distribute throughout the extracellular space, and these fluids expand the extracellular volume.
2. Colloid fluids are sodium-rich electrolyte solutions that contain large molecules that do not pass readily out of the bloodstream. The retained molecules hold water in the intravascular compartment; as a result, colloid fluids primarily expand the intravascular (plasma) volume.
Table 11.3 Different Types of Resuscitation Fluid
The influence of different types of resuscitation fluids on cardiac output is shown in Figure 11.6 (31). The infusion volume of each fluid (except Ringer’s lactate) is roughly the same. The colloid fluid (dextran-40) is clearly the most effective fluid for augmenting cardiac output, while the crystalloid fluid (Ringer’s lactate) is only about 25% as effective, despite having twice the infusion volume. Packed RBCs are the least effective in promoting cardiac output, and have actually been shown to decrease cardiac output (32). This is due to the viscosity effect of the concentrated erythrocytes in packed RBCs, and this viscosity effect also explains why whole blood is less effective than the colloid fluid for augmenting cardiac output.
Figure 11.6 thus demonstrates that colloid fluids are much more effective than crystalloid fluids for promoting cardiac output.
Distribution of Infused Fluids
The superiority of colloid fluids over crystalloid fluids for augmenting cardiac output is explained by the distribution of each fluid. Crystalloid fluids are primarily sodium chloride solutions, and sodium is distributed uniformly in the extracellular fluid. Because plasma represents only 25% of the extracellular fluid, only 25% of the infused volume of crystalloid fluids will remain in the vascular space and add to the plasma volume, while the remaining 75% will add to the interstitial fluid volume (33). Colloid fluids, on the other hand, have large molecules that do not readily escape from the bloodstream, and these retained molecules hold water in the intravascular compartment. As a result, as much as 100% of the infused volume of colloid fluids will remain in the vascular space and add to the plasma volume (33), at least in the first few hours after infusion. The increase in plasma volume augments cardiac output not only by increasing ventricular preload (volume effect) but also by decreasing ventricular afterload (dilutional effect on blood viscosity).
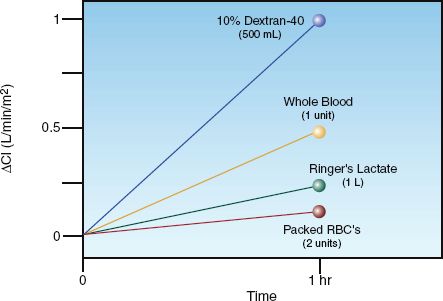
FIGURE 11.6 Change in cardiac index after a one-hour infusion of different resuscitation fluids. The infusion volumes are roughly equivalent (500 mL), except for Ringers lactate (1 liter). From Reference 31.
The Preferred Fluid
Despite the superiority of colloid fluids for increasing plasma volume and promoting cardiac output, crystalloid fluids have been the preferred resuscitation fluid for hemorrhagic shock for the past 50 years. The origins of this preference will be described in the next chapter; the principal reasons for the crystalloid preference are the low cost of crystalloid fluids and the lack of a documented survival benefit with colloid resuscitation (34). The favored crystalloid fluid is Ringer’s lactate, which does not produce the metabolic acidosis that accompanies high-volume resuscitation with isotonic saline (see Figure 12.3).
Colloid fluids remain a reasonable choice in hypovolemia that is not associated with acute blood loss, particularly since ICU patients often have a low plasma oncotic pressure, which will be lowered further by crystalloid resuscitation. There is also much concern about the deleterious effects of high-volume crystalloid resuscitation, including edema formation in the lungs, heart, and intestinal tract, and the abdominal compartment syndrome (34). Chapter 12 has a more detailed comparison of colloid and crystalloid fluid resuscitation.
Standard Resuscitation Regimen
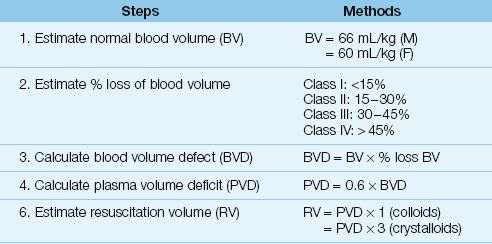
The standard practice for managing a trauma victim who presents with active bleeding or hypotension is to infuse 2 liters of crystalloid fluid over 15 minutes (35). If hypotension or bleeding continue, packed RBCs are infused along with crystalloid fluids to maintain a mean blood pressure ≥65 mm Hg. The volume of crystalloid resuscitation will be about 3 times the estimated volume of plasma loss, as shown in Table 11.4 (assume a ≥30% loss of blood volume in hemorrhagic shock). When bleeding is controlled and the patient is stable hemodynamically, the threshold for further RBC transfusions is a hemoglobin of 7 g/dL, or ≥9 g/dL in patients with active coronary artery disease (36).
Table 11.4 Estimating Resuscitation Volumes for Asanguinous Fluids
Damage Control Resuscitation
Because uncontrolled exsanguinating hemorrhage is the leading cause of death in hemorrhagic shock, the following practices are being adopted to limit the extent of bleeding in cases of massive blood loss (defined as the loss of one blood volume in 24 hours). These practices are part of an overall approach known as damage control resuscitation (37).
Hypotensive Resuscitation
Observations with combat injuries and penetrating trauma have shown that aggressive volume replacement can exacerbate bleeding before the hemorrhage is controlled (34,37). This has led to an emphasis on permitting low blood pressures (i.e., systolic BP = 90 mm Hg or mean BP = 50 mm Hg) in trauma patients with hemorrhagic shock until the bleeding is controlled. This strategy has been shown to reduce resuscitation volumes (38,39), and increase survival rates (38). Low blood pressures are allowed only if there is evidence of adequate organ perfusion (e.g., patient is awake and follows commands).
Hemostatic Resuscitation
FRESH FROZEN PLASMA: For the resuscitation of massive blood loss, the traditional practice has been to give one unit of fresh frozen plasma (FFP) for every 6 units of packed RBCs (34). However, the discovery that severely injured trauma victims often have a coagulopathy on presentation (40) has led to the practice of giving one unit of FFP for every one or two units of packed RBCs, and several studies have shown improved survival rates with this practice (34,37,41). Transfusion of FFP is aimed at maintaining an INR <1.5 and an activated PTT <1.5 times normal (42).
CRYOPRECIPITATE: Although FFP is a good source of fibrinogen (2–5 g/L), cryoprecipitate provides equivalent amounts of fibrinogen in a much smaller volume (3.2–4 grams in 150–200 mL, which is 2 “pools” of cryoprecipitate) (42). Therefore, cryoprecipitate can be used to maintain serum fibrinogen levels (>1 g/L) if volume control is desirable.
PLATELETS: The standard practice of giving one unit of platelets for every 10 units of packed RBCs has also been questioned, and improved survival rates have been recorded when one unit of platelets is given for every 2 to 5 units of packed RBCs (34). The optimal ratio of platelets to packed RBCs has yet to be determined, and platelet transfusions can be guided by the platelet count. The standard goal is to maintain a platelet count >50,000/∝L when bleeding is active, but some advocate a platelet count >75,000/∝L until bleeding is controlled (42).
Avoiding Hypothermia
Severe trauma is accompanied by loss of thermoregulation, and trauma-related hypothermia (body temp <32° C) is associated with increased mortality, possibly from reduced activity of coagulation factors and platelets (37). Since hypothermia is a risk with infusion of room- temperature fluids and cold blood products (stored at 4° C), in-line fluid warmers are used routinely for the resuscitation of massive blood loss (28). The use of warming blankets and in-line fluid warmers has reduced the incidence of hypothermia to <1% in combat support hospitals (37).
End-Points of Resuscitation
A summary of the general goals and associated end-points of resuscitation for hemorrhagic shock are shown in Figure 11.7. (Some of these end-points, such as the cardiac output and the O2 transport parameters, are not routinely available.) Limiting blood loss and prompt reversal of tissue ischemia are the most important considerations, and normalization of serum lactate levels within 24 hours is one of the most important end-points.
POSTRESUSCITATION INJURY
The restoration of blood pressure and hemoglobin levels in hemorrhagic shock does not ensure a satisfactory outcome because it can be followed in 48–72 hours by progressive multiorgan failure (43). The earliest manifestation of postresuscitation injury is progressive respiratory dysfunction from the acute respiratory distress syndrome (described in Chapter 23), and this can be followed within 5–6 days by progressive dysfunction involving the kidneys, liver, heart, and central nervous system. The mortality rate is determined by the number of organs involved, and averages 50–60% (43).
Pathophysiology
Postresuscitation injury is a form of reperfusion injury (44) that is believed to originate in the splanchnic circulation, where reperfusion of ischemic bowel releases proinflammatory cytokines that gain access to the systemic circulation and activate circulating neutrophils, which adhere to the walls of capillaries and migrate into the parenchyma of vital organs to incite inflammatory injury (43). (This is the underlying mechanism for the multiorgan failure associated with sepsis, as described in Chapter 14.)
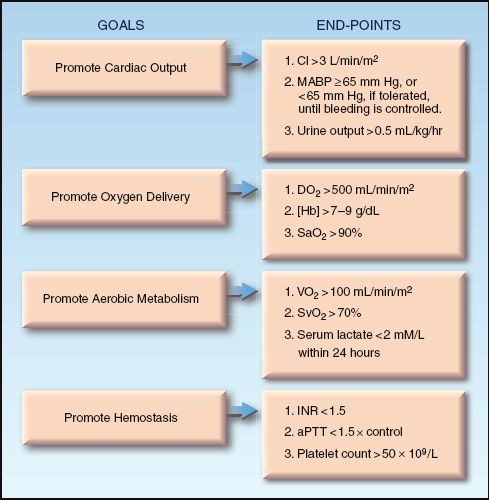
FIGURE 11.7 The general goals and associated end-points of resuscitation for hemorrhagic shock. CI = cardiac index; MABP = mean arterial blood pressure; DO2 = systemic O2 delivery; [Hb] = hemoglobin concentration in blood; VO2 = systemic O2 consumption; SvO2 = mixed venous O2 saturation; INR = international normalized ratio; aPTT = activated partial thromboplastin time.
Several factors predispose to postresuscitation injury, including the time required to reverse tissue ischemia (e.g., lactate clearance >24 hours), the volume of crystalloid resuscitation (i.e., predisposes to the abdominal compartment syndrome), the number of units of RBCs transfused (>6 units in 12 hrs), and the age of the transfused blood (stored >3 weeks) (43). Infection may be involved if the onset of multiorgan failure is more than 3 days after the resuscitation effort (43).
Management
There is no specific therapy for postresuscitation injury, and preventive measures such as rapid reversal of ischemia, limiting the resuscitation volume (both crystalloid fluids and RBC products) and avoiding the transfusion of old blood, if possible, are advised. In late-onset multiorgan failure (onset >72 hrs after resuscitation), recognition and prompt treatment of underlying sepsis is crucial.
A FINAL WORD
The following points in this chapter deserve emphasis:
1. The clinical evaluation of intravascular volume, including the use of central venous pressure (CVP) measurements, is so flawed it has been called a “comedy of errors” (7).
2. Direct measurements of blood volume are clinically feasible, but are underutilized .
3. Colloid fluids are much more effective than crystalloid fluids for expanding the plasma volume and promoting cardiac output, yet crystalloid fluids are preferred for the resuscitation of hemorrhagic shock because of cost considerations and the lack of a survival benefit with colloid resuscitation.
4. In the severely injured patient, damage control resuscitation incorporates alternative strategies like hypotensive resuscitation (maintaining a lower-than-usual blood pressure until bleeding is controlled) and hemostatic resuscitation (giving fresh frozen plasma and platelets more frequently than usual).
5. Return of serum lactate levels to normal within 24 hours is the end-point of resuscitation that is the most predictive of a satisfactory outcome.
6. Multiorgan failure can appear 48–72 hours after resuscitation of hemorrhagic shock as a result of reperfusion-induced systemic inflammation.
REFERENCES
Body Fluids and Blood Loss
1. Walker RH (ed). Technical Manual of the American Association of Blood Banks. 10th ed., Arlington, VA: American Association of Blood Banks, 1990:650.
2. Moore FD, Dagher FJ, Boyden CM, et al. Hemorrhage in normal man: I. Distribution and dispersal of saline infusions following acute blood loss. Ann Surg 2966; 163:485–504.
3. Moore FD. Effects of hemorrhage on body composition. New Engl J Med 1965; 273:567–577.
4. American College of Surgeons. Advanced Trauma Life Support Manual, 7th ed. Chicago, IL: American College of Surgeons, 2004.
5. Schadt JC, Ludbrook J. Hemodynamic and neurohumoral responses to acute hypovolemia in conscious animals. Am J Physiol 1991; 260:H305–H318.
6. Fiddian-Green RG. Studies in splanchnic ischemia and multiple organ failure. In Marston A, Bulkley GB, Fiddian-Green RG, Haglund UH, eds. Splanchnic ischemia and multiple organ failure. St. Louis, CV Mosby, 1989:349–364.
Assessment of Blood Volume
7. Marik PE. Assessment of intravascular volume: A comedy of errors. Crit Care Med 2001; 29:1635.
8. McGee S, Abernathy WB, Simel DL. Is this patient hypovolemic. JAMA 1999; 281:1022–1029.
9. Sinert R, Spektor M. Clinical assessment of hypovolemia. Ann Emerg Med 2005; 45:327–329.
10. Cordts PR, LaMorte WW, Fisher JB, et al. Poor predictive value of hematocrit and hemodynamic parameters for erythrocyte deficits after extensive vascular operations. Surg Gynecol Obstet 1992; 175:243–248.
11. Stamler KD. Effect of crystalloid infusion on hematocrit in nonbleeding patients, with applications to clinical traumatology. Ann Emerg Med 1989; 18:747–749.
12. Kumar A, Anel R, Bunnell E, et al. Pulmonary artery occlusion pressure and central venous pressure fail to predict ventricular filling volumes, cardiac performance, or the response to volume infusion in normal subjects. Crit Care Med 2004; 32:691–699.
13. Marik PE, Baram M, Vahid B. Does central venous pressure predict fluid responsiveness? Chest 2008; 134:172-178.
14. Oohashi S, Endoh H. Does central venous pressure or pulmonary capillary wedge pressure reflect the status of circulating blood volume in patients after extended transthoracic esophagectomy? J Anesth 2005; 19:21–25.
15. Kuntscher MV, Germann G, Hartmann B. Correlations between cardiac output, stroke volume, central venous pressure, intra-abdominal pressure and total circulating blood volume in resuscitation of major burns. Resuscitation 2006; 70:37–43.
16. Revelly JP, Tappy L, Martinez A, et al. Lactate and glucose metabolism in severe sepsis and cardiogenic shock. Crit Care Med 2005; 33:2235–2240.
17. Okorie ON, Dellinger P. Lactate: biomarker and potential therapeutic agent. Crit Care Clin 2011; 27:299–326.
18. Abramson D, Scalea TM, Hitchcock R, et al. Lactate clearance and survival following injury. J Trauma 1993; 35:584–589.
19. Enomoto TM, Harder L. Dynamic indices of preload. Crit Care Clin 2010; 26:307–321.
20. Antonelli M, Levy M, Andrews PJD, et al. Hemodynamic monitoring in shock and implications for management. International Consensus Confer-ence, Paris France, 2006. Intensive Care Med 2007; 33:575–590.
21. Cecconi M, Parsons A, Rhodes A. What is a fluid challenge? Curr Opin Crit Care 2011; 17:290–295.
22. Monnet X, Rienzo M, Osman D, et al. Passive leg raising predicts fluid responsiveness in the critically ill. Crit Care Med 2006; 34:1402–1407.
23. Cavallaro F, Sandroni C, Marano C, et al. Diagnostic accuracy of passive leg raising for prediction of fluid responsiveness in adults: systematic review and meta-analysis of clinical studies. Intensive Care Med 2010; 36:1475–1483.
24. Mahjoub Y, Touzeau J, Airapetian N, et al. The passive leg-raising maneuver cannot accurately predict fluid responsiveness in patients with intra-abdominal hypertension. Crit Care Med 2010; 36:1824–1829.
25. Yu M, Pei K, Moran S, et al. A prospective randomized trial using blood volume analysis in addition to pulmonary artery catheter, compared with pulmonary artery catheter alone to guide shock resuscitation in critically ill surgical patients. Shock 2011; 35:220–228.
Infusing Fluids
26. Chien S, Usami S, Skalak R. Blood flow in small tubes. In Renkin EM, Michel CC (eds). Handbook of Physiology. Section 2: The cardiovascular system. Volume IV. The microcirculation. Bethesda: American Physiological Society, 1984:217–249.
27. Buchman TG, Menker JB, Lipsett PA. Strategies for trauma resuscitation. Surg Gynecol Obstet 1991; 172:8–12.
28. Barcelona SL, Vilich F, Cote CJ. A comparison of flow rates and warming capabilities of the Level 1 and Rapid Infusion Systems with various-size intravenous catheters. Aneth Analg 2003; 97:358–363.
29. Hyman SA, Smith DW, England R, et al. Pulmonary artery catheter introducers: Do the component parts affect flow rate? Anesth Analg 1991; 73:573–575.
30. de la Roche MRP, Gauthier L. Rapid transfusion of packed red blood cells: effects of dilution, pressure, and catheter size. Ann Emerg Med 1993; 22:1551–1555.
Resuscitation Strategies
31. Shoemaker WC. Relationship of oxygen transport patterns to the pathophysiology and therapy of shock states. Intensive Care Med 1987; 213:230–243.
32. Marik PE, Sibbald WJ. Effect of stored-blood transfusion on oxygen delivery in patients with sepsis. JAMA 1993; 269:3024–3029.
33. Imm A, Carlson RW. Fluid resuscitation in circulatory shock. Crit Care Clin 1993; 9:313–333..
34. Dantry HP, Alam HB. Fluid resuscitation: past, present, and future. Shock 2010; 33:229–241.
35. American College of Surgeons. Shock. In Advanced Trauma Life Support Manual, 7th ed. Chicago: American College of Surgeons, 2004:87–107.
36. Napolitano LM, Kurek S, Luchette FA, et al. Clinical practice guideline: red blood cell transfusion in adult trauma and critical care. Cit Care Med 2009; 37:3124–3157.
37. Beekley AC. Damage control resuscitation: a sensible approach to the exanguinating surgical patient. Crit Care Med 2008; 36:S267–S274.
38. Bickell WH, Wall MJ Jr, Pepe PE, et al. Immediate versus delayed fluid resuscitation for hypotensive patients with penetrating torso injuries. N Engl J Med 1994; 331:1105–1109.
39. Morrison CA, Carrick M, Norman MA, et al. Hypotensive resuscitation strategy reduces transfusion requirements and severe postoperative coagulopathy in trauma patients with hemorrhagic shock: preliminary results of a randomized controlled trial. J Trauma 2011; 70:652–663.
40. Brohi K, Singh J, Heron M, Coats T. Acute traumatic coagulopathy. J Trauma 2003; 54:1127–1130.
41. Magnotti LJ, Zarzaur BL, Fischer PE, et al. Improved survival after hemostatic resuscitation: does the emperor have no clothes? J Trauma 2011; 70:97–º102.
42. Stainsby D, MacLennan S, Thomas D, et al, for the British Committee for Standards in Hematology. Guidelines on the management of massive blood loss. Br J Haematol 2006; 135:634–641.
Postresuscitation Injury
43. Dewar D, Moore FA, Moore EE, Balogh Z. Postinjury multiorgan failure. Injury 2009; 40:912–918.
44. Eltzschig HK, Collard CD. Vascular ischaemia and reperfusion injury. Br Med Bull 2004; 70:71–86.


Full access? Get Clinical Tree


